A recent conversation with a credit union CEO reinforced a pattern I continue to see across mid-market organizations.
His credit union has invested significantly in CRM systems, digital member experience platforms, workflow automation, and process optimization. They have a dedicated Business Solutions team focused on improving operations and implementing technology across business units. They track KPIs at the departmental level. They think actively about ROI from these investments.
But when I asked how they connect technology adoption to business outcomes over time, the conversation shifted.
Not because they haven’t thought about it. Because connecting activity to outcomes is harder than it looks.
Most organizations don’t struggle with buying technology. They struggle with proving it worked.
The Measurement Gap
Technology investments are measured at the extremes.
On one end: adoption metrics. Login rates. Feature usage. Training completion. System uptime.
On the other end: business outcomes. Revenue growth. Cost reduction. Member satisfaction. Profitability.
The problem is the gap between them.
A CRM shows 85% daily login rates. Revenue grew 12% this year. Did the CRM cause the growth? Contribute to it? Have no relationship to it at all?
Most organizations can’t answer that question with confidence. Not because they lack data, but because the connection between user activity and business outcomes isn’t direct.
It’s a chain reaction. And most of the dominoes in that chain are invisible.
The Domino Effect
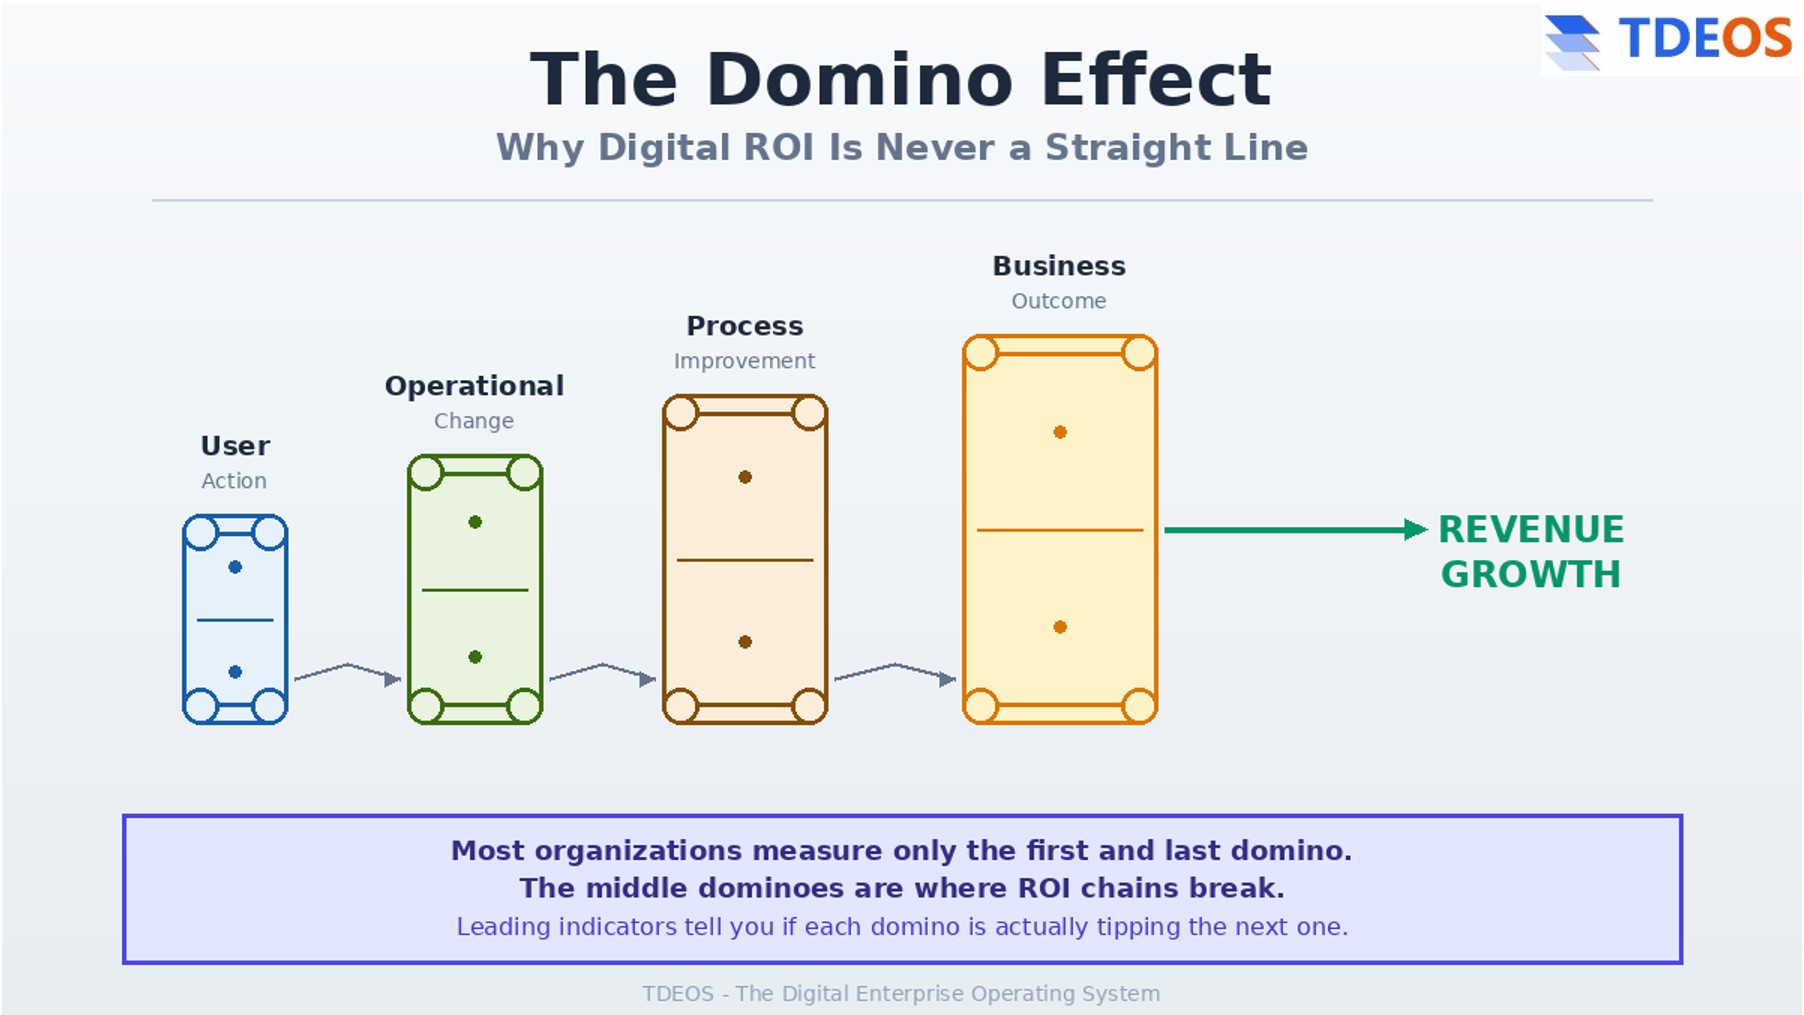
Imagine a line of dominoes of different sizes.
The first domino is small. A loan officer logs into the CRM and updates a member conversation. One user action in one system.
That small domino tips a slightly larger one. The updated conversation triggers a workflow notification to the mortgage team. Now there’s operational coordination that wasn’t happening before.
That medium domino tips a larger one. The mortgage team responds faster because the context from the conversation is already in the system. Response time improves from three days to one day.
That larger domino tips an even larger one. Faster response time means more members complete applications instead of abandoning them. Application completion rate improves.
That domino tips the largest one. Higher completion rates mean more closed loans. Revenue increases.
This is how technology ROI actually works.
It’s not a straight line from “we implemented a CRM” to “revenue grew.” It’s a chain of intermediate outcomes, each one enabling the next, each one dependent on the one before it.
The loan officer logging the conversation is the first domino. Revenue growth is the last domino. But there are four or five dominoes in between that have to fall in sequence for the chain to reach the business outcome.
Most organizations only measure the first domino and the last domino. They miss the middle.
Why the Middle Dominoes Matter
The credit union CEO I spoke with has good instincts about this. His Business Solutions team isn’t just implementing technology. They’re trying to improve workflows and operational effectiveness.
That’s the middle of the domino chain. Where technology adoption translates into operational change.
But here’s where it gets hard.
You can’t see the middle dominoes falling just by looking at CRM login rates or revenue reports. You have to identify what the intermediate dominoes are and measure whether they’re actually tipping.
In the loan example, the middle dominoes might be:
Loan officers update member conversations within 24 hours instead of letting notes pile up at end of week.
Mortgage team response time improves from three days to one day because they have context immediately.
Application abandonment rate decreases from 40% to 25% because members aren’t waiting days for responses.
Close rate on completed applications improves from 60% to 70% because the process feels responsive instead of bureaucratic.
Each of these is measurable. Each of these is a domino that has to fall for technology investment to translate into revenue growth.
If loan officers are logging in but not updating conversations within 24 hours, the first domino isn’t actually tipping the second one. The chain stops.
If mortgage team response time hasn’t improved, the second domino isn’t tipping the third. The chain stops.
You can have 90% CRM adoption and zero revenue impact if the dominoes in the middle aren’t falling.
Leading Indicators vs Lagging Indicators
This is why organizations need both leading indicators and lagging indicators.
Lagging indicators tell you what already happened. Revenue. Profitability. Growth. Member retention. Cost reduction.
These matter. They’re what the board cares about. They’re how you justify technology investments after the fact.
But by the time lagging indicators move, it’s often too late to course-correct.
If you’re measuring revenue growth as your primary indicator of CRM success, and revenue hasn’t moved 18 months after implementation, what do you do? The money is spent. The system is deployed. You’re trying to diagnose what went wrong long after the decisions that caused the problem were made.
Leading indicators tell you whether you’re on track before the lagging indicators move.
In the domino analogy, leading indicators measure whether the early dominoes are falling. Whether the chain reaction is progressing the way it needs to for business outcomes to eventually materialize.
Going back to the loan example:
Leading indicator: Percentage of member conversations logged within 24 hours.
Leading indicator: Average mortgage team response time to new applications.
Leading indicator: Application abandonment rate.
Leading indicator: Conversion rate on completed applications.
Lagging indicator: Total loan volume and revenue.
If conversation logging drops from 80% to 60%, that’s an early signal. The first domino isn’t tipping consistently. You can intervene before it affects revenue.
If mortgage response time starts creeping back up from one day to two days, that’s a signal. The second domino is weakening. You can address it before application abandonment increases.
Leading indicators give you time to adjust. Lagging indicators tell you whether the adjustments worked.
Most organizations measure only the lagging indicators. Then they’re surprised when technology investments don’t deliver expected ROI.
The Real ROI Question
The conversation with the credit union CEO clarified something important.
The question isn’t “Did the CRM deliver ROI?”
The question is “Did we create the conditions for the CRM to deliver ROI?”
Technology doesn’t create business outcomes by itself. Technology enables operational changes that create business outcomes.
If you implement a CRM but don’t change how loan officers document conversations, the CRM doesn’t improve anything. The first domino never tips.
If loan officers change their behavior but the mortgage team doesn’t change response protocols, the second domino doesn’t tip. The chain stops.
If both teams change behavior but nobody’s measuring application abandonment rates or conversion rates, you don’t know whether the middle dominoes are falling. You’re flying blind until revenue either moves or doesn’t.
Good ROI thinking connects the chain:
User behavior (loan officer logs conversation within 24 hours) ↓ Operational behavior (mortgage team responds in one day instead of three) ↓ Process effectiveness (application abandonment decreases, conversion increases) ↓ Business outcomes (loan volume and revenue grow)
Each arrow in that chain is a domino tipping the next one. Each arrow is something you can measure. Each arrow is a point where the chain can break if the conditions aren’t right.
What Organizations Get Wrong
Most organizations approach digital ROI measurement in one of three ways, and all three miss the middle dominoes.
Approach 1: Measure only adoption.
Track login rates, feature usage, training completion. Assume that if people are using the system, outcomes will follow automatically.
This misses the fact that using a system doesn’t mean using it effectively. Loan officers can log in daily and still not document conversations promptly. You get high adoption metrics and zero operational improvement.
Approach 2: Measure only business outcomes.
Track revenue, cost reduction, member satisfaction. Assume that if technology was worth the investment, these will move.
This misses the chain of intermediate outcomes that have to happen first. When business outcomes don’t move, you have no diagnostic insight into what broke in the chain. You just know it didn’t work.
Approach 3: Measure everything.
Track 47 different KPIs across adoption, operations, and outcomes. Create dashboards that show every metric the platform can produce.
This misses the fact that not all metrics matter equally. The first domino and the last domino aren’t equally important to track in real time. The middle dominoes are where intervention can change the trajectory.
What organizations need is a measurement framework that maps the domino chain and focuses on the points where the chain is most likely to break.
Building a Domino Map
The credit union CEO and I didn’t solve this in one conversation. But we talked through what a domino map might look like for their member experience initiatives.
The framework is straightforward:
Identify the business outcome you’re trying to move. Revenue growth? Cost reduction? Member retention? Pick one outcome and work backward.
Identify the last operational domino before that outcome. What has to improve operationally for the business outcome to materialize? In the loan example, it’s application conversion rates. Applications have to convert at higher rates for revenue to grow.
Identify the domino before that. What has to improve for conversion to increase? Application abandonment has to decrease. Members have to stay engaged through the process.
Keep working backward until you reach user behavior. What user actions in the CRM enable faster response times that reduce abandonment? Loan officers documenting conversations promptly so mortgage teams have context immediately.
Now you have a chain. Four or five dominoes from user action to business outcome.
Each domino is a measurable operational metric. Each domino is a leading indicator for the one after it.
Track the dominoes in sequence. If the first three are falling but the fourth isn’t, you know where the chain is breaking. You can intervene at the specific point of failure instead of trying to diagnose the entire system.
Why This Matters for Mid-Market Organizations
Enterprise companies have resources to build sophisticated ROI measurement frameworks. Dedicated analytics teams. Business intelligence platforms. Data scientists who can model causal relationships between dozens of variables.
Mid-market organizations don’t have those resources.
You’re running a 200-person credit union or a 400-person manufacturing company or a 150-person healthcare organization. You have one person in business solutions or IT or operations who’s responsible for technology ROI measurement in addition to their other responsibilities.
You can’t build a data science function. You can’t instrument every possible metric. You need a framework that’s simple enough to implement with limited resources but rigorous enough to actually connect activity to outcomes.
The domino map is that framework.
It doesn’t require sophisticated analytics. It requires clear thinking about causal chains.
What user behavior has to change for operational effectiveness to improve? What operational improvements have to happen for process outcomes to change? What process outcomes drive business results?
Answer those questions and you have your leading indicators. Measure those and you know whether your technology investments are on track long before revenue moves or doesn’t.
The Conversation I Keep Having
The credit union CEO isn’t unique. I have this conversation regularly with mid-market leaders who’ve invested in CRM, ERP, workflow automation, digital experience platforms, or process optimization technology.
The pattern is consistent.
They bought the technology thoughtfully. They implemented it properly. They trained their teams. Adoption looks good.
But they’re not confident the investment is delivering the outcomes they expected. And they’re not sure how to measure whether it’s working beyond “revenue grew this year” or “costs went down.”
The domino effect gives them a way to think about it differently.
Technology ROI isn’t binary. It’s not “it worked” or “it didn’t work.” It’s a chain of intermediate outcomes that either materialize in sequence or break at some point along the way.
Your job isn’t to prove the technology worked. Your job is to create the conditions for each domino to tip the next one, and to measure whether that’s actually happening.
If it is, business outcomes will follow. Not immediately, but predictably.
If it isn’t, you’ll know where the chain broke and what needs to change. Not 18 months later when revenue didn’t move, but early enough to intervene.
That’s the difference between measuring technology adoption and measuring technology impact.
Adoption tells you the first domino is in place. Impact tells you the chain is progressing toward the outcome that justifies the investment.
Mid-market organizations need both. But most are only measuring the first.
What to Do About It
If you’re leading digital transformation initiatives and struggling to connect technology investments to business outcomes, start with one initiative and map the dominoes.
Pick the business outcome that matters most. Work backward to the operational improvements that drive it. Work backward again to the user behaviors that enable those improvements.
You’ll end up with three to five measurable points in the chain from activity to outcome.
Those are your leading indicators.
Measure them monthly. Track whether they’re improving, holding steady, or declining. Watch for points where the chain weakens before it breaks entirely.
When a domino stops tipping the next one, you have a specific intervention point. Not “the CRM isn’t working.” Something more precise: “Loan officers aren’t documenting conversations promptly” or “Mortgage team response time is creeping back up.”
That’s actionable. You can fix a specific behavior or workflow issue. You can’t fix “the CRM isn’t delivering ROI.”
The domino map won’t solve every measurement challenge. But it will give you visibility into whether your technology investments are progressing toward outcomes or stalling somewhere in the middle.
For mid-market organizations without dedicated analytics teams, that visibility is often the difference between technology that eventually delivers and technology that sits unused after the initial adoption push fades.
The credit union CEO understood this immediately. His Business Solutions team is already focused on workflows and operational effectiveness. They just needed a clearer framework for connecting those improvements to the business outcomes that justify the technology spend.
That’s what the domino effect provides. Not a measurement system. A thinking tool.
A way to map the chain reaction you’re trying to create and track whether it’s actually happening.
Because technology ROI is never a straight line. It’s a sequence of dominoes that either fall in order or break somewhere along the way.
Your job is to know which dominoes matter, measure whether they’re falling, and intervene when the chain stops progressing.
That’s how technology investments become business outcomes. One domino at a time.
Related Resources
Articles on CRM Health:
CRM Drift: Why CRM Systems Fail After Implementation
https://tdeos.com/crm/crm-drift/
Shadow CRM Systems: When Teams Build Their Own Tracking Tools
https://tdeos.com/crm/shadow-crm/
Why Leadership Stops Trusting the CRM
https://tdeos.com/when-leadership-stops-trusting-the-crm/
Four Platforms Made the Same AI Bet: Why Mid-Market Should Wait
https://tdeos.com/insights/ai-agents-mid-market-four-platforms/